Appointments vs. Staffing
Introduction & Background
Analyze the relationship between the number of primary care appointments per head of population and staffing levels per head of population. The goal is to investigate how the patient-to-GP ratio correlates with appointments per head specifically in the context of SNEE compared to broader English sub-ICBs.
Data Sources
The primary data for this analysis is derived from the extensive appointments dataset, GP Patient list and the staffing dataset provided by NHS England.
| Dataset used | Website URL | Download zip |
|---|---|---|
| Appointments dataset | NHS Digital - Appointments in General Practice | Actual_Duration_CSV_Aug_24.csv |
| Registred patients dataset | NHS Digital - Patients Registered at a GP practice | gp-reg-pat-prac-quin-age.csv |
| General Practice workforce | NHS Digital - General Practice Workforce | General Practice – August 2024 Individual Level.csv |
| Appointments by Region dataset | NHS Digital - GP Appointments by Region | Regional_CSV_SuffolkNEEssex.csv |
- Number of patients is a snapshot of patients in Sep/2024
- Workforce is also a snapshot of staff but in Aug/2024
- Appointments are the sum of latest year appointments (Aug/23 - Aug/24)
Methodology
The analysis involved a systematic approach to pre-process, integrate, and analyze datasets to explore relationships between key variables and predict outcomes. Below are the steps undertaken:
-
Data Pre-processing and Integration:
- Each dataset was pre-processed based on specific requirements and then merged into a single comprehensive dataset.
-
Calculation of Key Ratios: Several ratios were computed to facilitate analysis, including:
- All Appointments per Head of Population: Count of all appointments / Number of Patients
- GP Appointments per Head of Population: Count of GP appointments / Number of Patients
- Staffing per 1,000 Registered Population: (Combined Staff FTE / Number of Patients) * 1000
- Patient-to-GP Ratio: Number of Patients / GP FTE
-
Analysis of Staffing Levels and Primary Care Appointments:
- The relationship between staffing levels and all primary care appointments (per head of population) was assessed using Spearman's and Pearson's correlation coefficients.
- A regression model was then employed to quantify the relationship.
-
Analysis of Patient-to-GP Ratio and GP Appointments:
- The relationship between the patient-to-GP ratio and GP appointments (per head of population) was similarly evaluated using correlation analysis (Spearman's and Pearson's).
- A regression model was run to understand and quantify this relationship.
-
Visual Comparison Across Regions:
- Patient-to-GP ratio and GP appointments per head of population were plotted for Integrated Care Boards (ICBs) and Sub-ICBs across England to enable regional comparisons.
-
Analysis of Age and GP Appointments:
- Patients were categorized into three age bands: 0–19, 20–64, and 65+.
- For each age band, correlations (Spearman's/Pearson's) were calculated to assess the relationship between age and GP appointments.
- Multiple regression models were run to predict GP appointment counts, with the best-performing model selected for further predictions.
-
Unmet Demand Estimation:
- Predicted and actual GP appointment counts were compared to calculate the proportion of unmet demand for each ICB and Sub-ICB.
- Predicted and actual GP appointment counts were compared to calculate the proportion of unmet demand for each ICB and Sub-ICB.
Results and Inferences
Staffing Levels and Primary Care Appointments:
- The correlation coefficient (0.6512) shows a moderate-to-strong positive relationship. This suggests that, as staffing levels per head increase, there is a significant tendency for appointments per head to also increase.
- The P-value (4.08e-14) is far below 0.05, confirming the correlation is statistically significant.
- Regression Results:
- Slope (1.4216): For every one-unit increase in staffing per 1k, All appointments per head increase by 1.4216.
- The slope is significant (p-value < 0.05).
- R-squared (0.424) indicates 42.4% of appointment variability is explained by staffing levels.
Patient-to-GP Ratio and GP Appointments:
- Pearson (-0.42) and Spearman (-0.41) coefficients show a moderate negative relationship. between Patient_to_gp_Ratio and GP Appointments per head
- The p-value (< 0.05) confirms th relationship is statistically significant.
- Regression Results:
- Coefficient (-0.0006): A one-unit increase in Patient-to-GP Ratio reduces GP appointments per head by 0.0006.
- The relationship is significant but has a negligible practical impact.
- While the relationship exists, the practical impact is negligible given the low R-squared value (0.177).
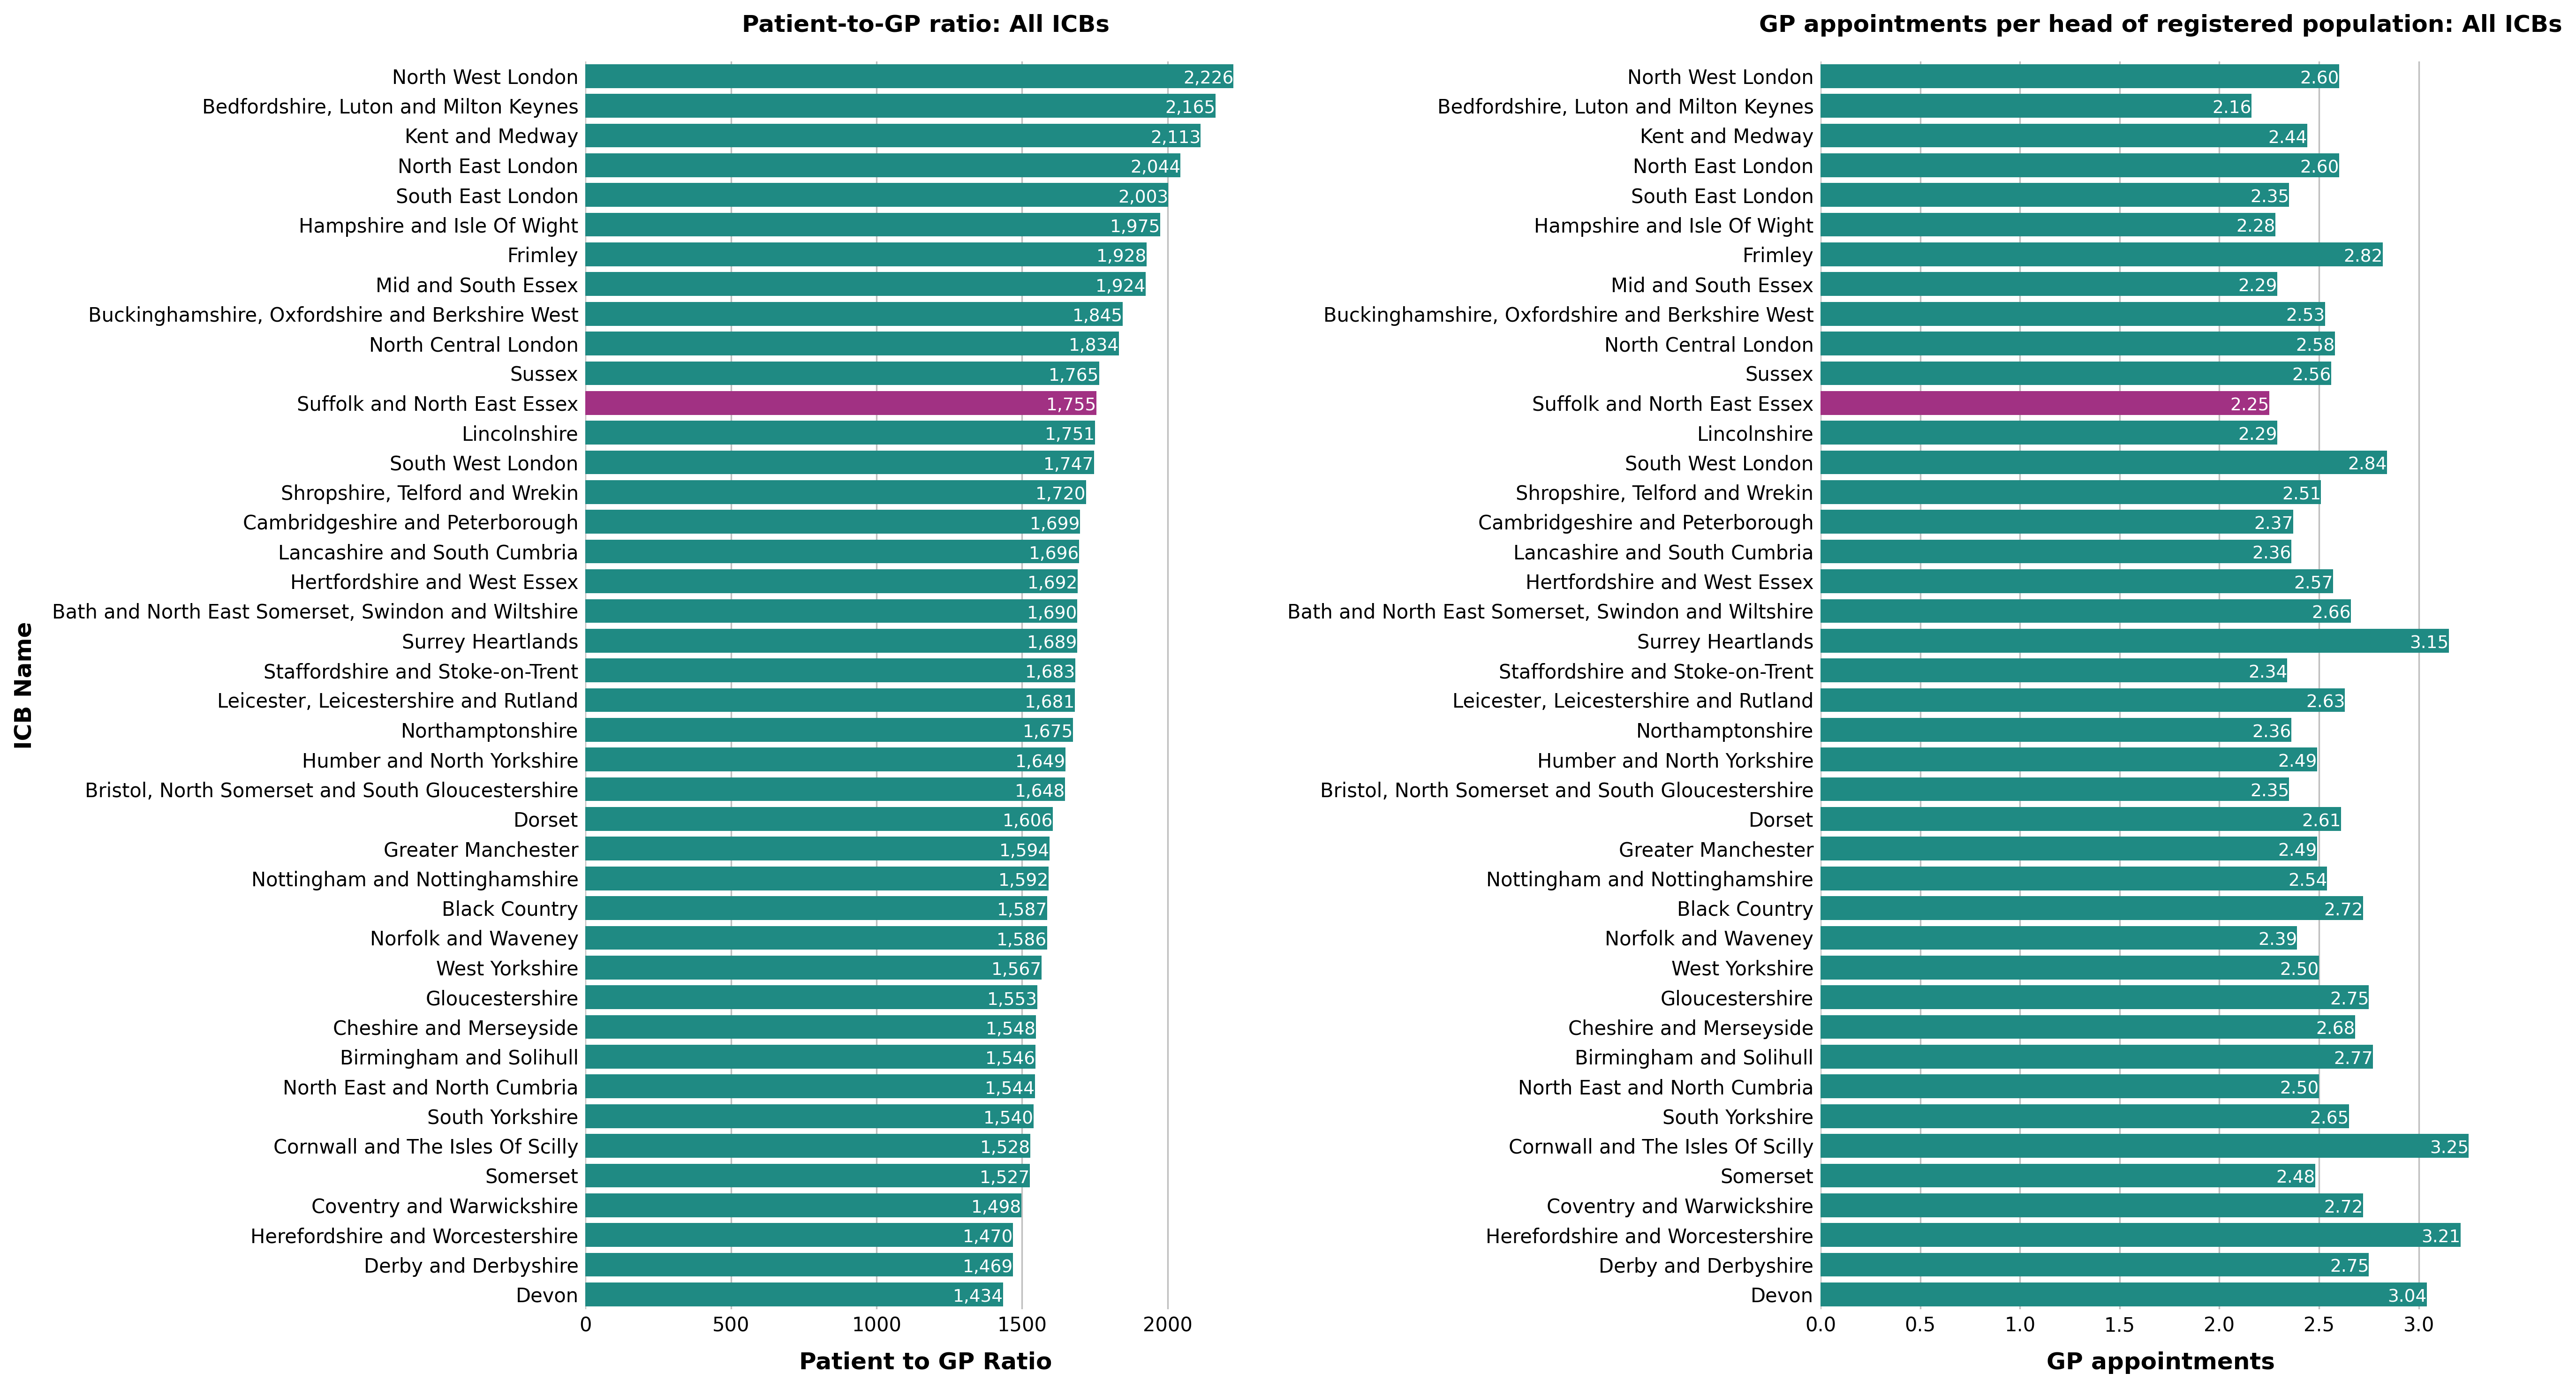
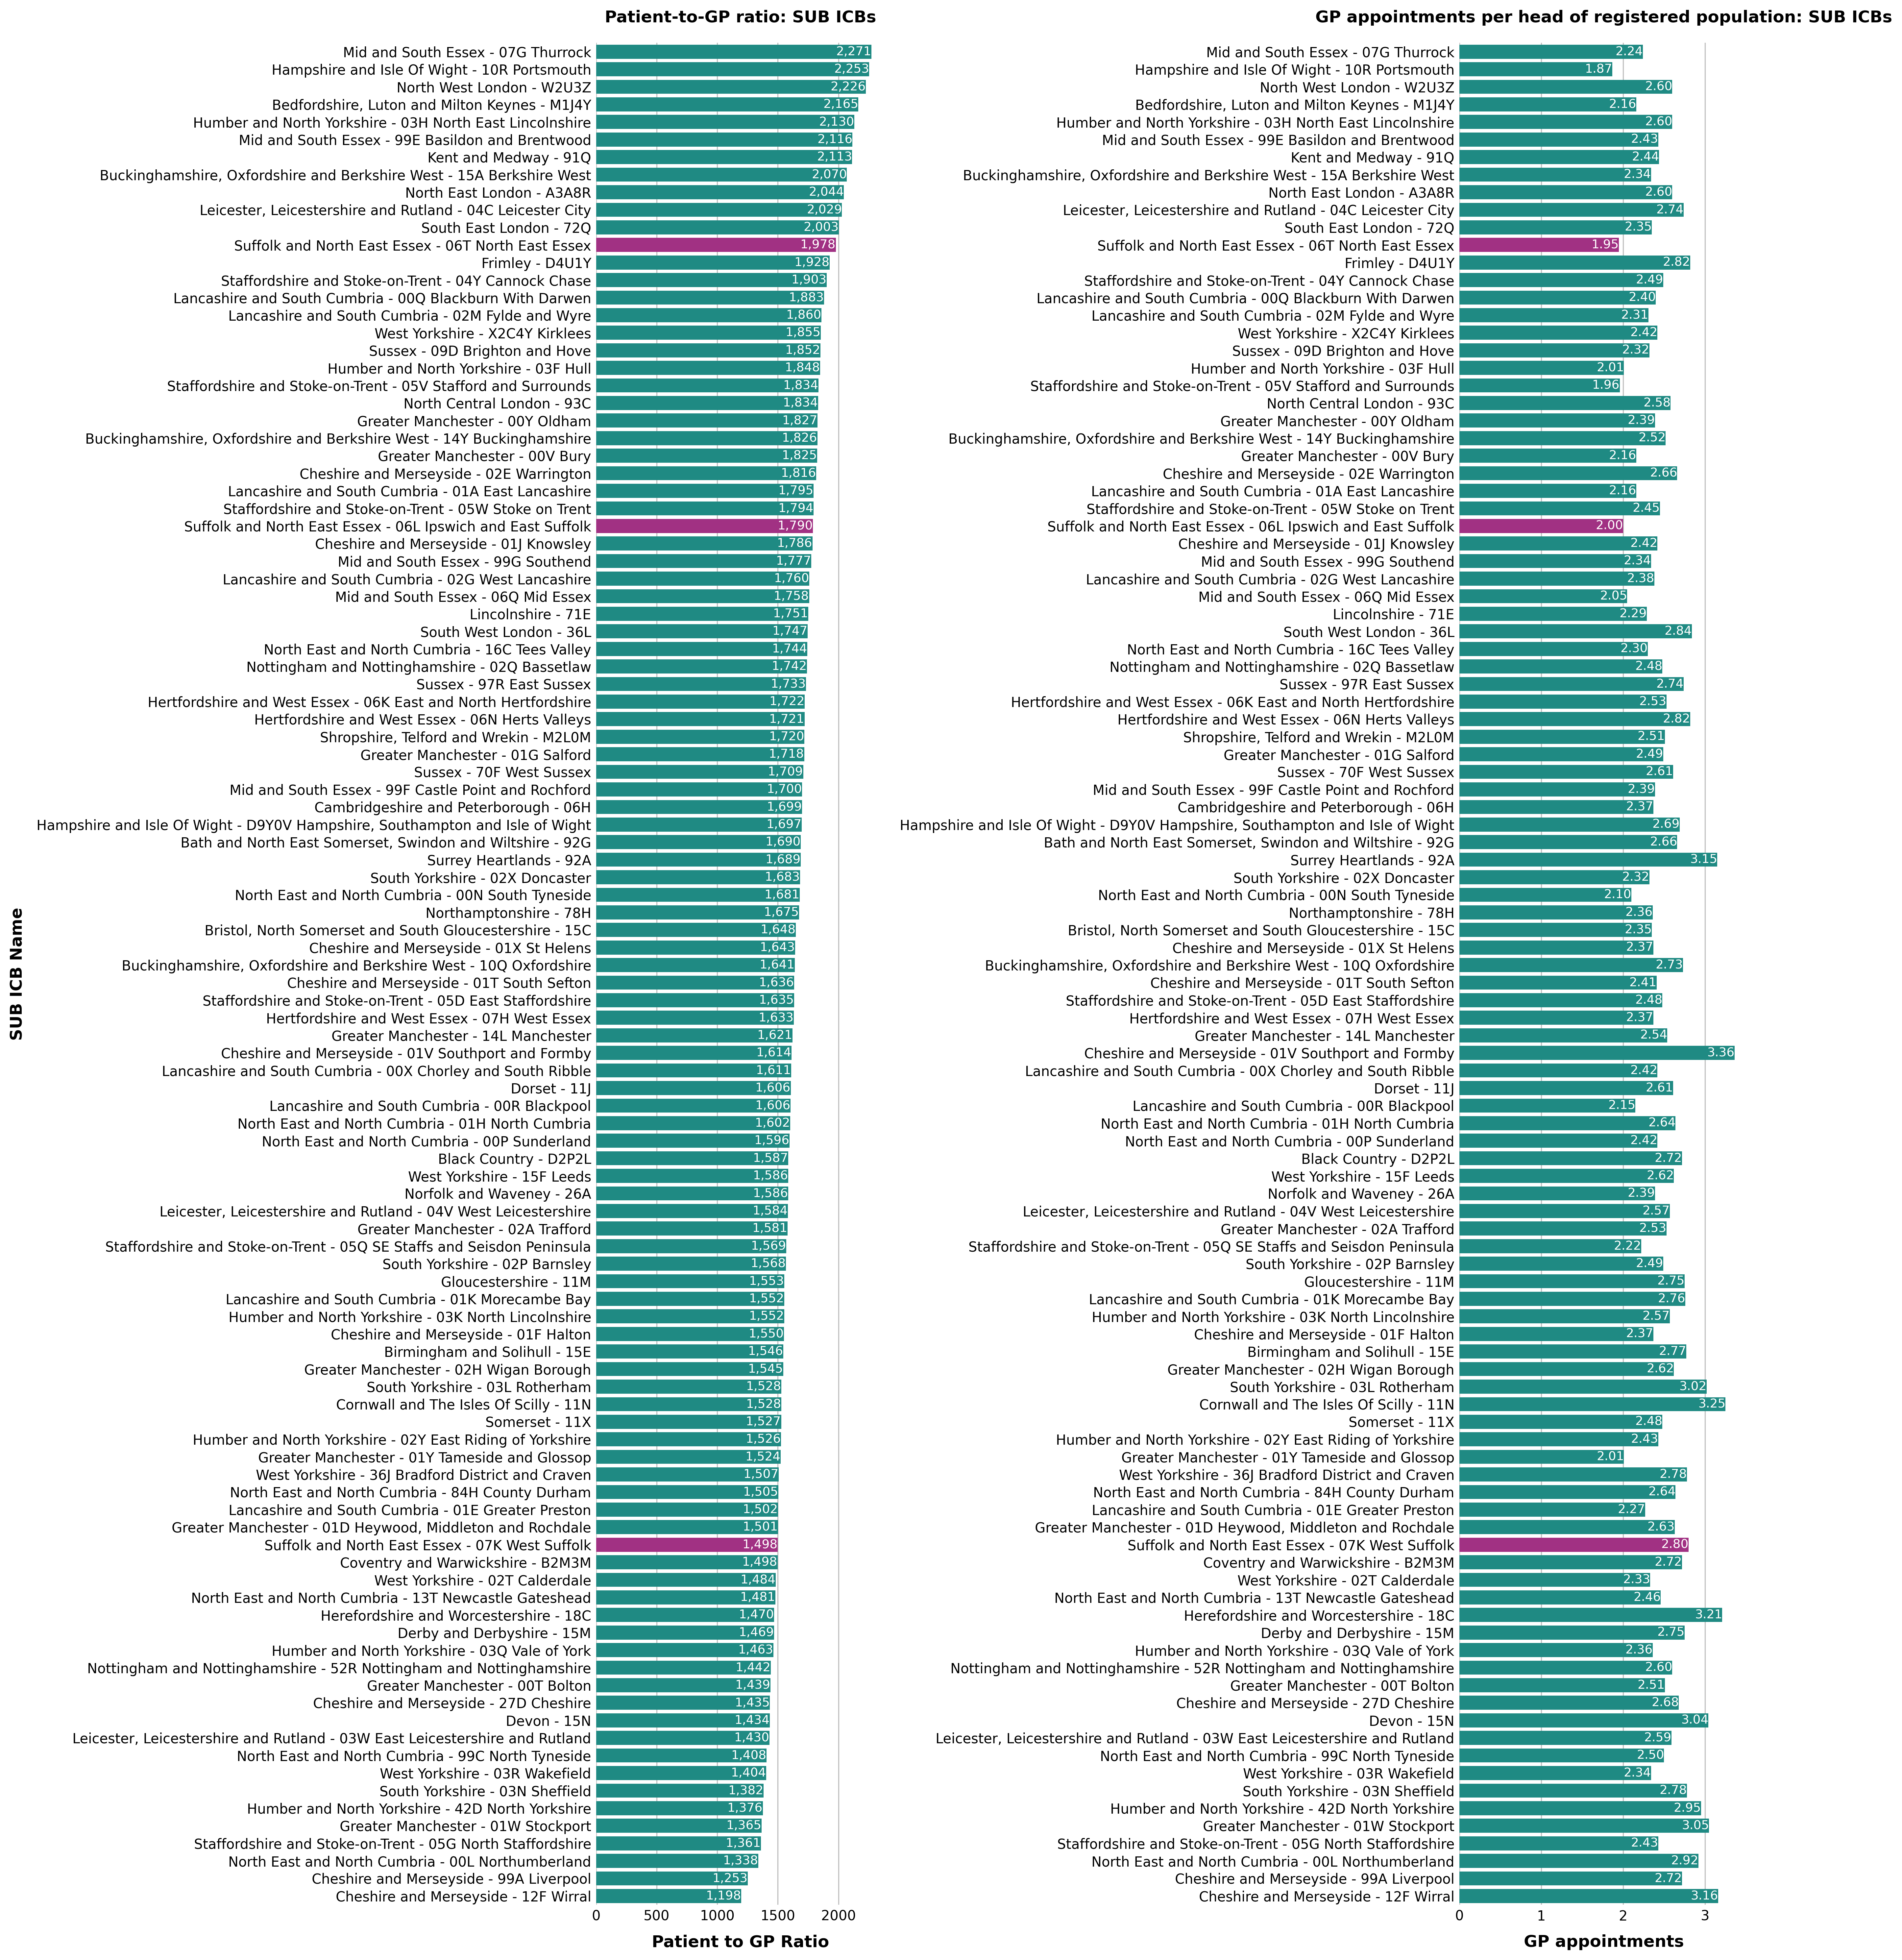
Visual Comparison Across Regions:
Comparisons of Patient-to-GP ratios and appointments per head across ICBs and Sub-ICBs are visualized in the graphs below:
-
ICB's
-
Sub-ICB's
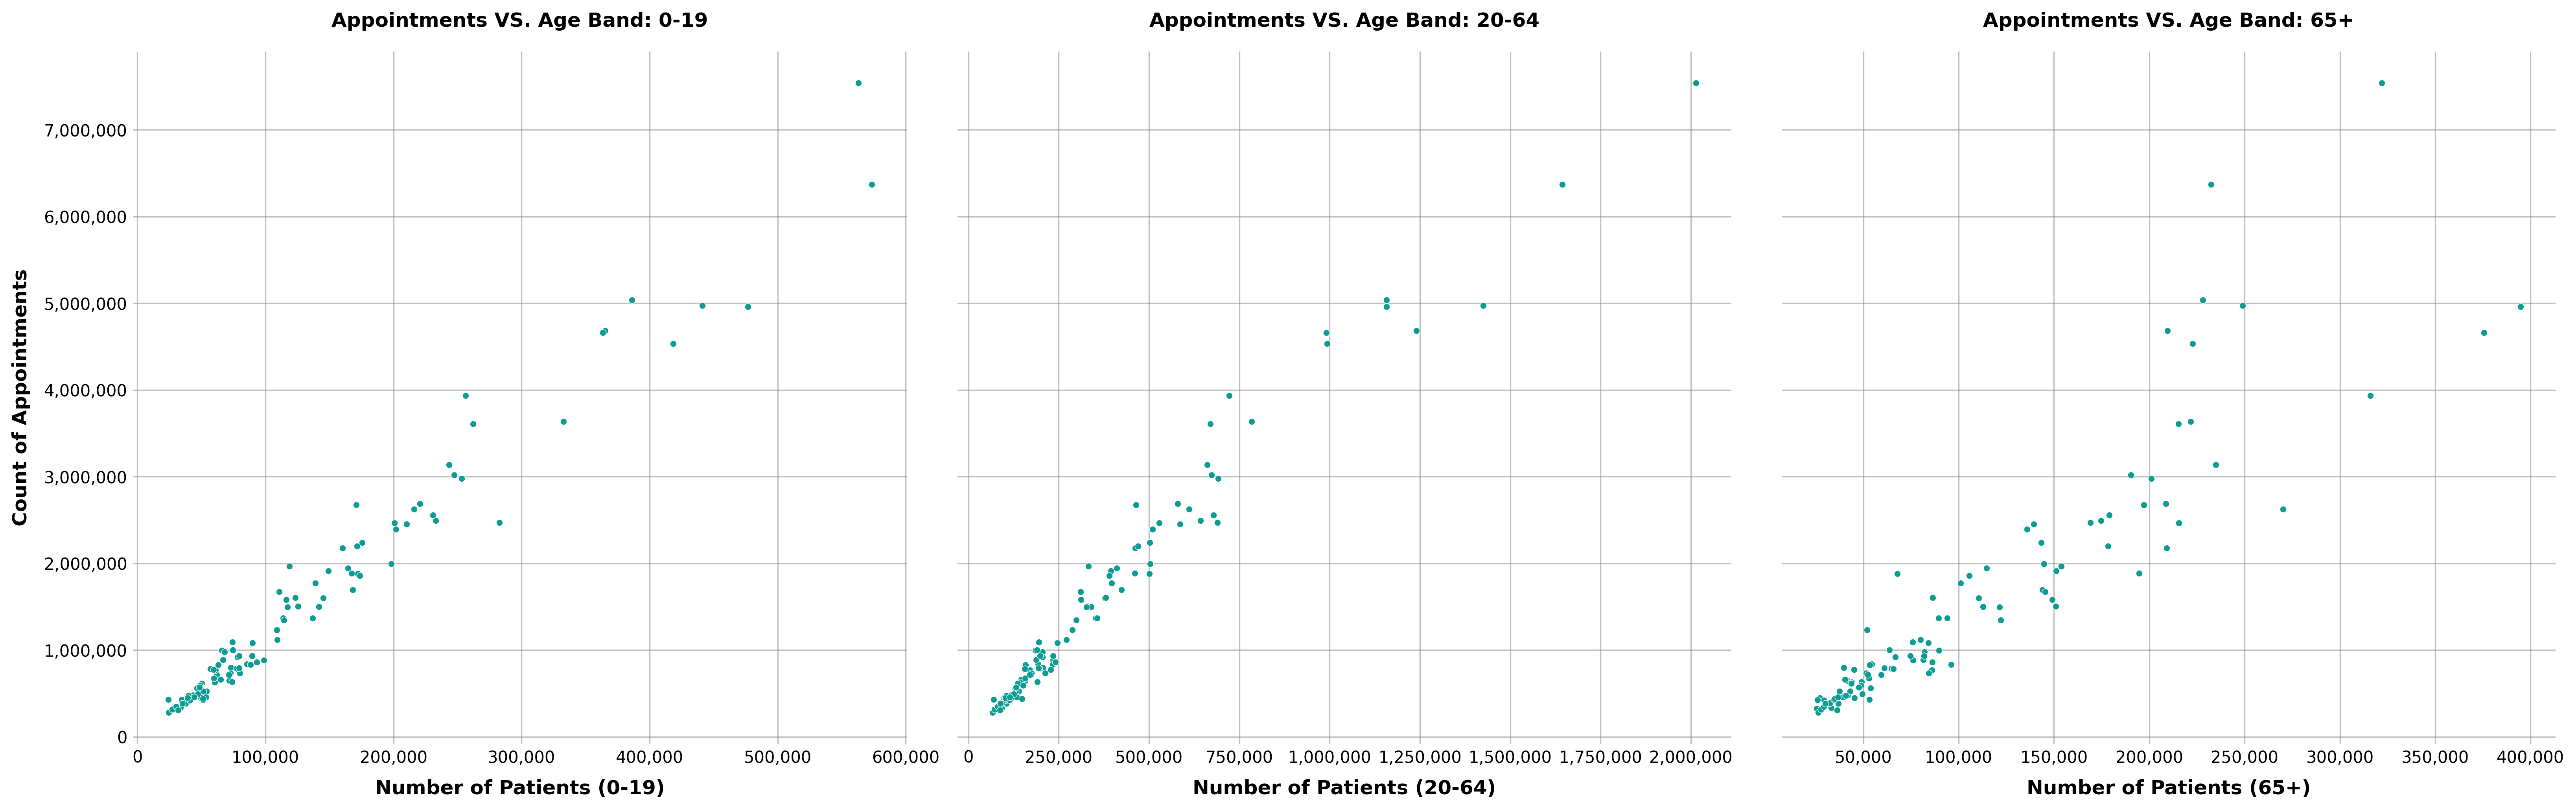
Analysis of Age and GP Appointments:
- Pearson and Spearman coefficients (> 0.95) indicate a very strong positive correlation. More patients in any age group result in more GP appointments.
- The p-value is extremely small, confirming the correlation is significant.
- Visualising the relation:
Regression Inferences:
- A 1 FTE increase in GPs increases annual appointments by 1,567.
- A one-person increase in the total population raises GP appointments by 2.46.
- A one-person increase in the 65+ group raises GP appointments by 3.635 (2.46 + 1.175).
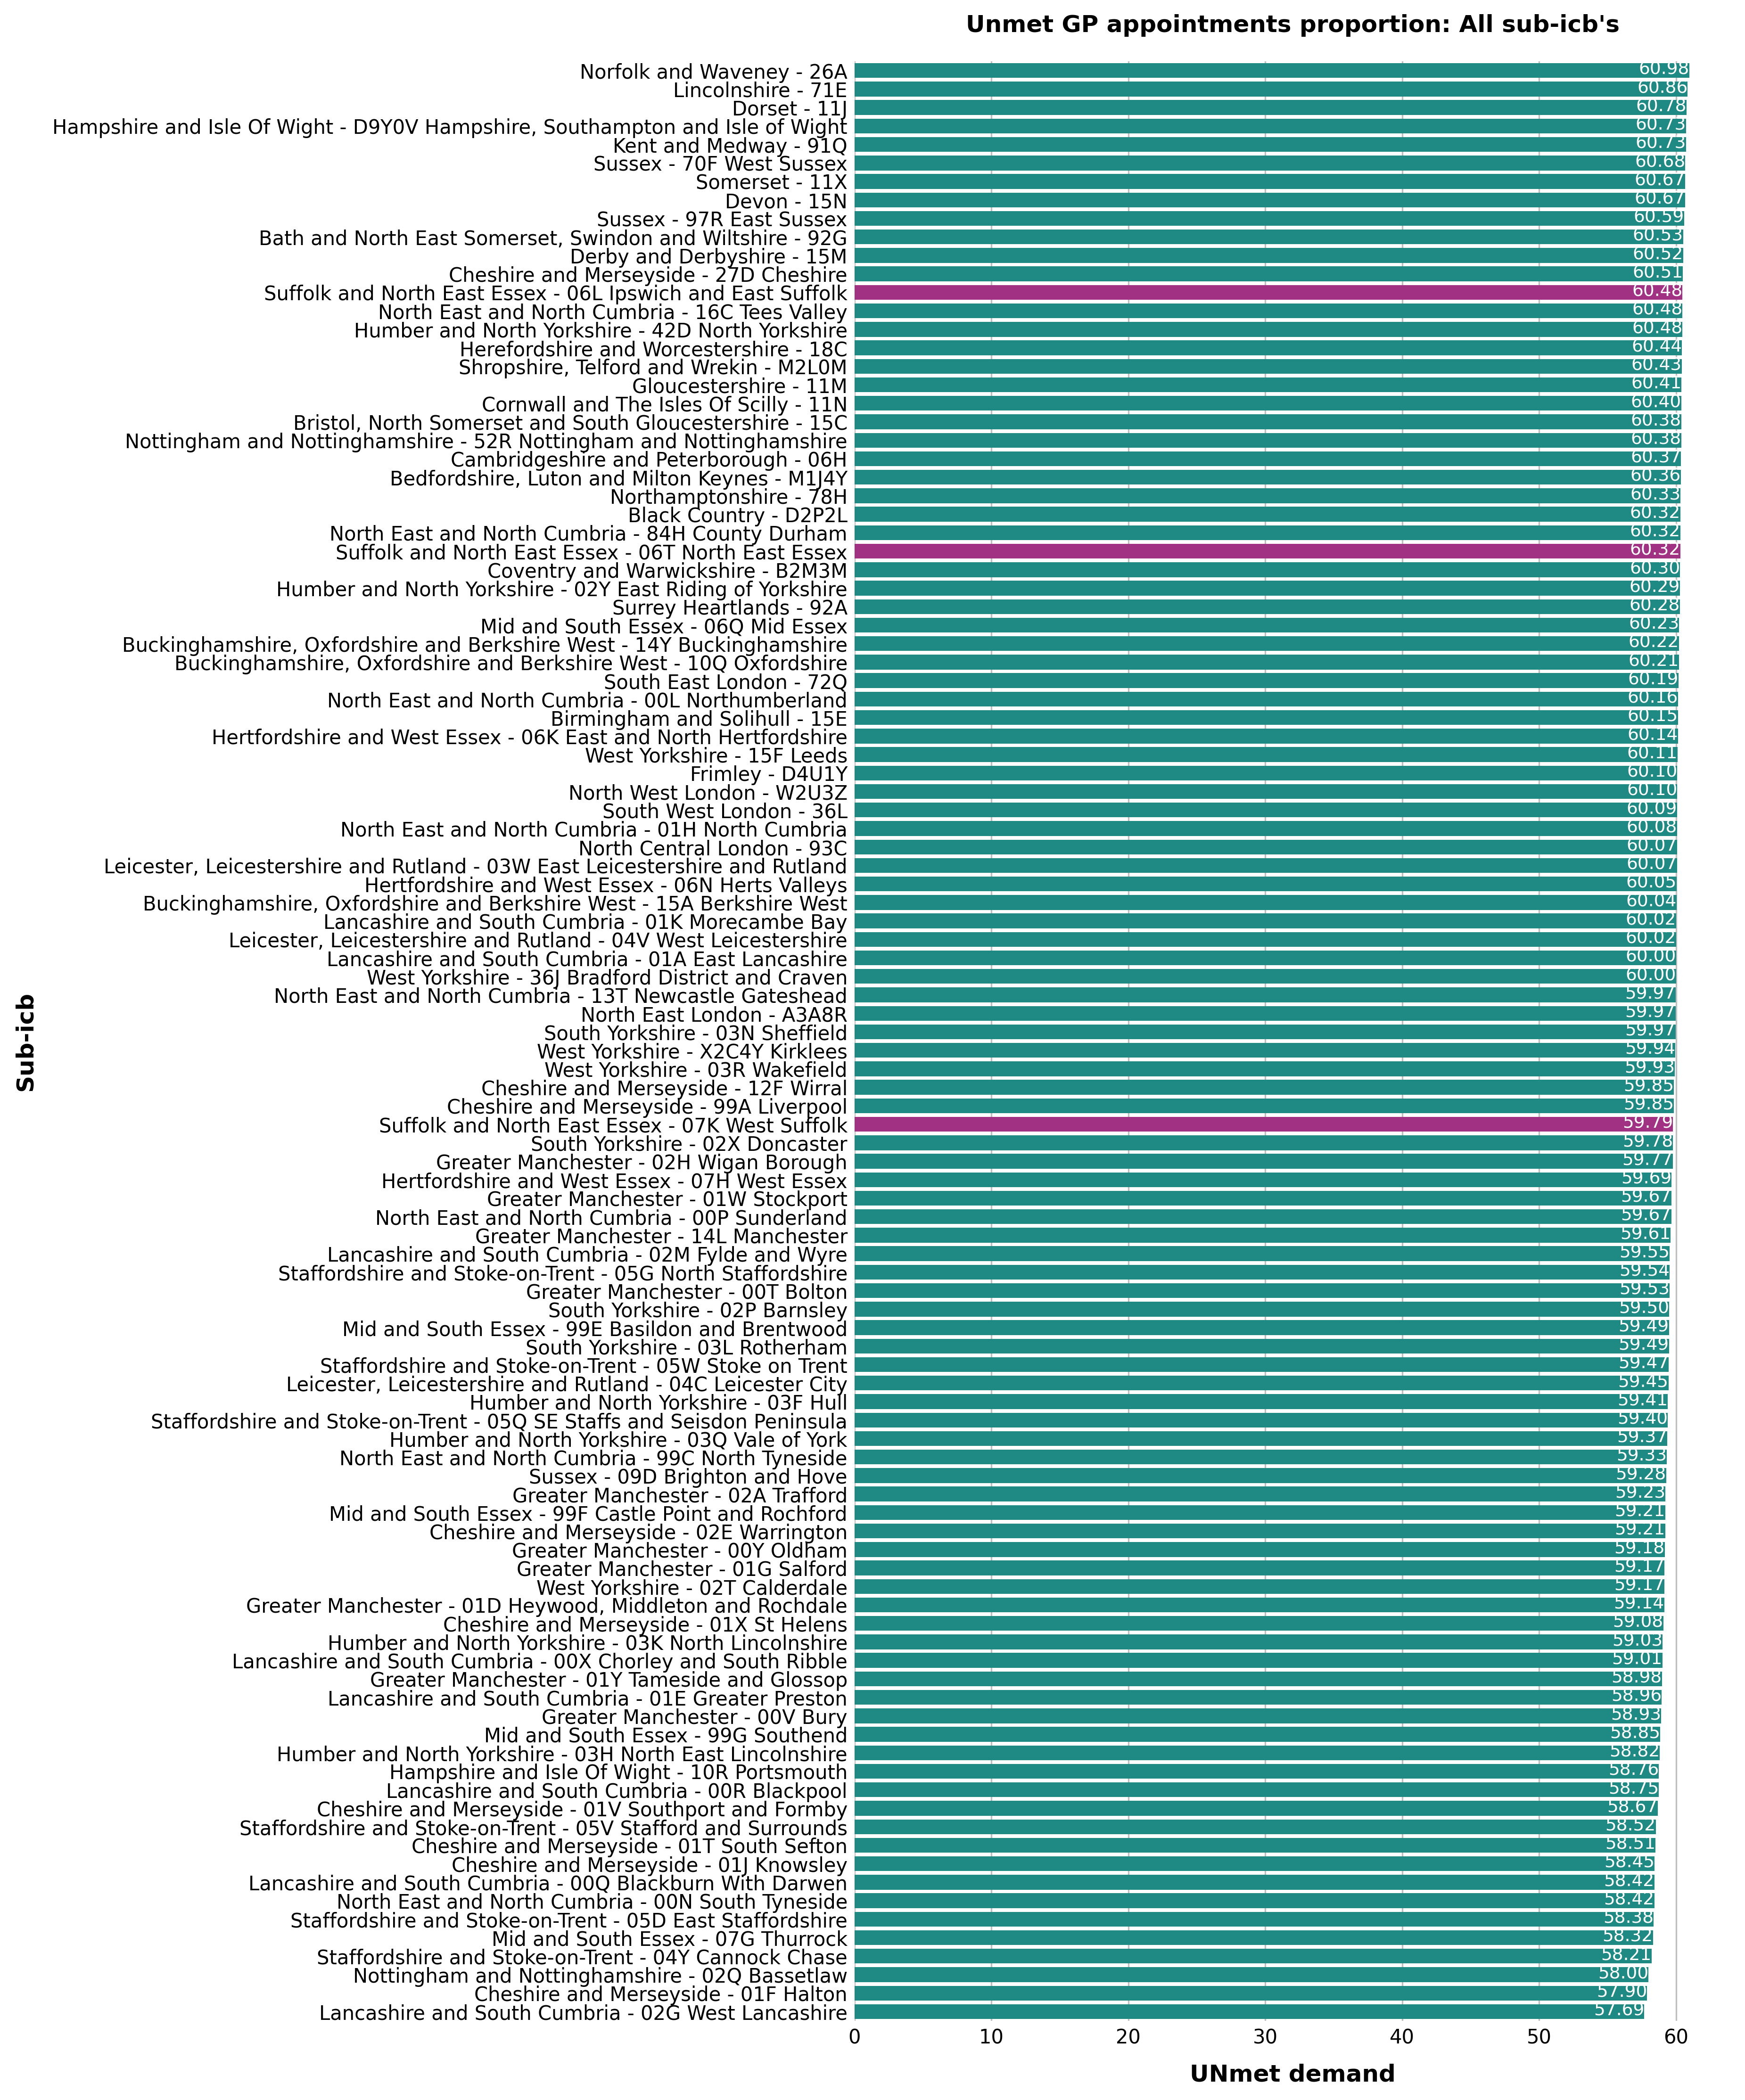
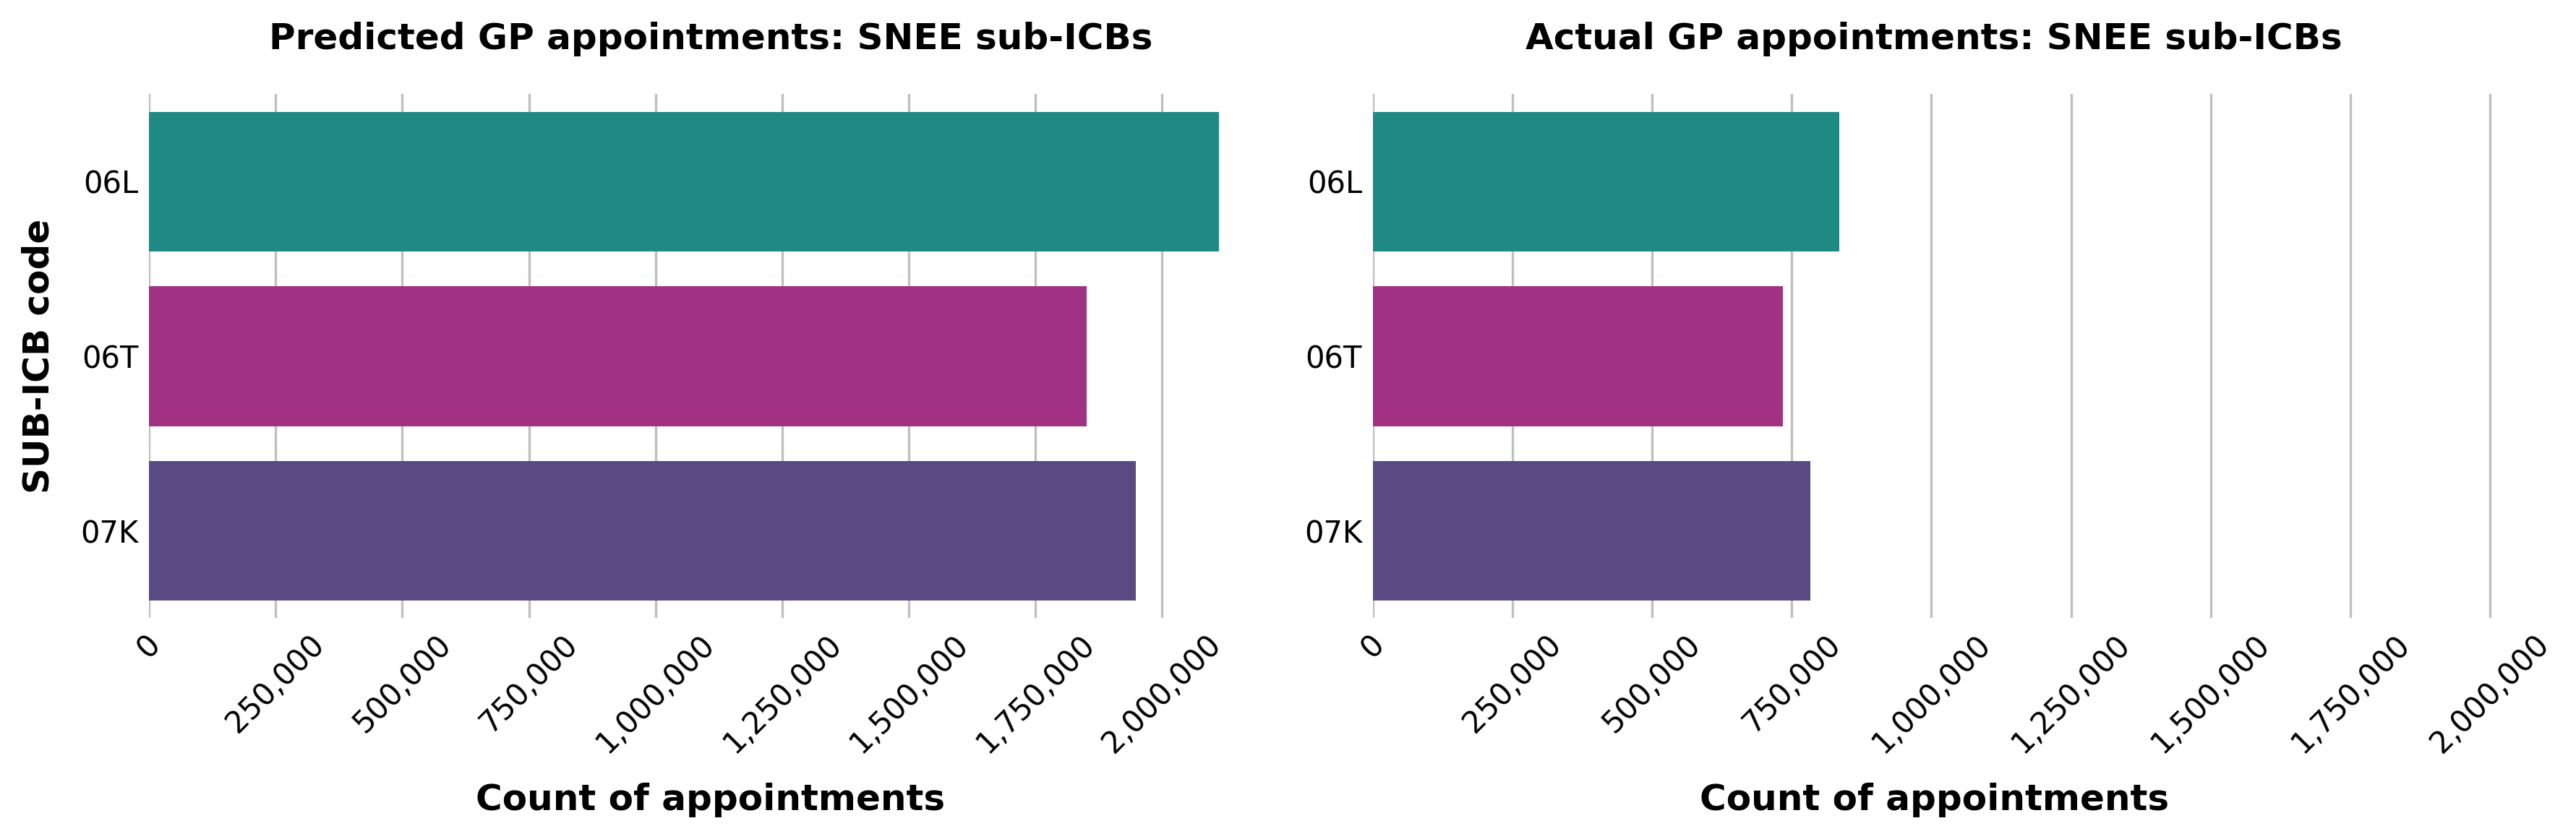
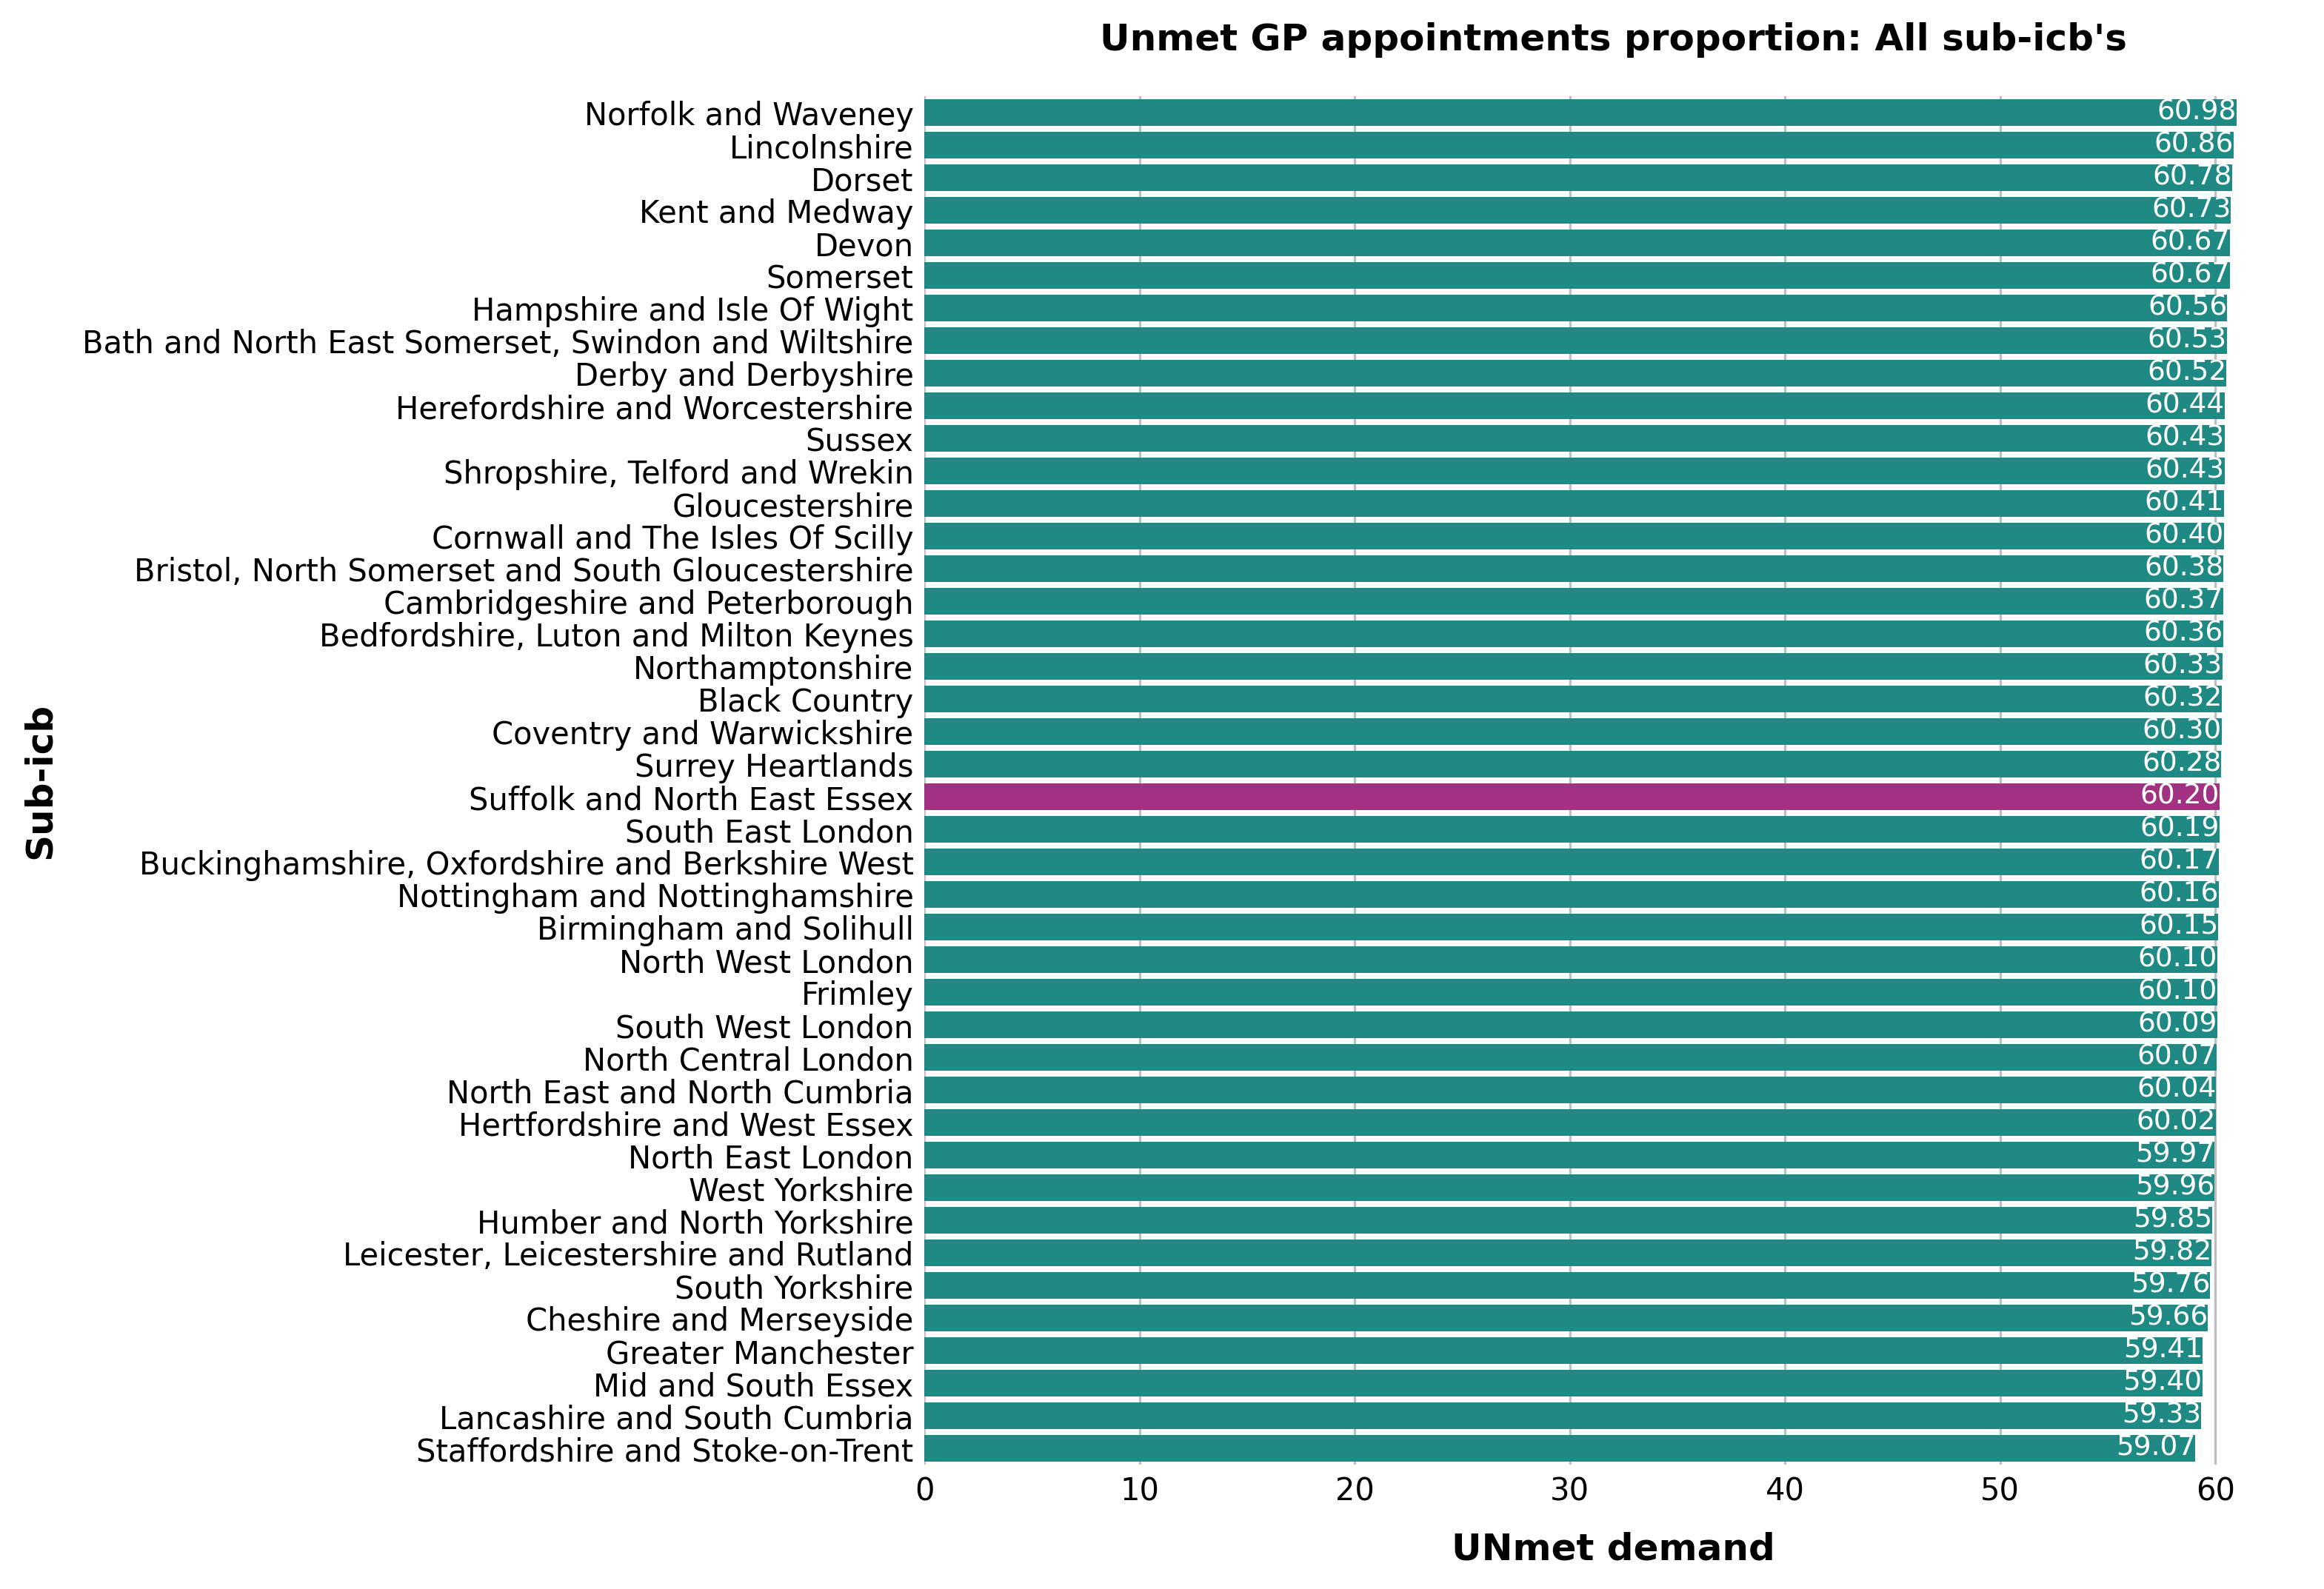
Unmet Demand Estimation:
-
Comparison of actual and predicted GP appointments:
-
Visualization of unmet demand across Integrated Care Boards (ICBs):
-
Visualization of unmet demand across Sub-Integrated Care Boards (Sub-ICBs):